SCIENTISTS CONFIRM EARTHQUAKE PREDICTION POSSIBLE
After over a decade of publishing my study and research paper, "mainstream research" is changing its attitude towards earthquake prediction. Wow. The endlessly repeated statements by them that it was impossible to predict earthquakes came to an abrupt and unpredictable end. Bravo. The only strange thing is that my old research results correspond exactly to what is currently being published by these gentlemen. See Reliable earthquake precursors?
Surprisingly, there are no facts or absolute proofs in the report, only hints of a possibility. Even the statement that an improvement in the measurement options by one order of magnitude would bring them closer to the solution sounds like a Sermon on the Mount in this phase. After all, they confirm that the measurement methods must be significantly improved in order to generate a usable signal from the noise. I am also very pleased with your assumption that hours before the earthquake significant "movement sequences" are evident. All of these, no better, exactly these occurrences on and in our earth, I explained ages ago and can be read here. Take note, my dear scientists, you have neither published nor created anything new. 22.07.2023
NEW MEASURING METHOD FOR EARLY DETECTION OF EARTHQUAKES
The measuring process is based on the development of a new optical and magnetic sensor. In combination with an extreme low-loss vibration system, docked to an innovative electronic signal analysis.
HISTORY
Self-employed and entrepreneur in diverse professions for 35 years. Holz-Electronics in Bergheim developed and produced, entertainment electronics measuring systems and mini computers for example.
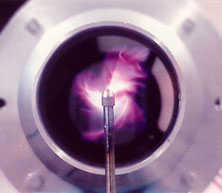
Another company developed special accelerators for atomic ion stimulation, based on their own patents.
Also familiar with precision engineering. Co-owner of several watch companies such as Glashütte original.

The knowledge base acquired by the companies throughout the years is enhanced like a perfect symbiosis. The individual company’s know-how is the perfect base for developing a measuring procedure for earthquake alerts. The experience in precision engineering derived from the watch company and the knowledge of atomic stimulation enabled me to penetrate the smallest “structures” and their interaction.
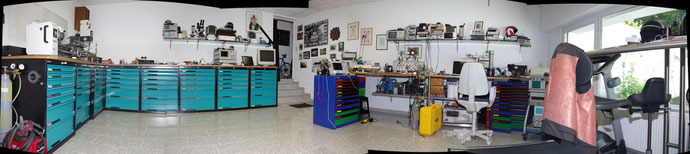
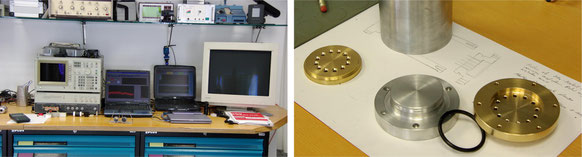
After a severe accident in 1998, I sold my companies. Now I am only researching matters that are close to my heart in a newly furnished laboratory in Remagen. As a scientist, I have always had my doubts about the invariability of natural constants, in particular field constants. In an effort to confirm this fact I built my own highly sensitive measuring system, such as a self-oscillating laser oscillator. Large in size and heavy, it was installed in the catacombs on the mountain’s rock surface.
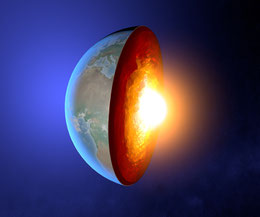
The featured device presented me with great challenges in the beginning phases. It did not function as I had expected. All anticipated repairs and calibrations were unsuccessful until the end of 2004. The severe and terrible earthquake at 9.2 occurred in Sumatra on 12/24/2004. The problems came to an abrupt halt. Additional assessments showed that the earth gravity and earth rotation changed the molecular atomic distance of the supporting granite slab and caused the laser oscillator to be out of tune. These results represented the birth of the current sensor.
Several modified, smaller and easier to handle devices are to be built for the “prediction of earthquakes” now.
Examples
All of these devices can detect the smallest signals. However, it was extremely difficult to determine the direction of a power.
Once you reach the sub-atomic segment, terms such as top, bottom, left and right etc. lose their meaning.
There is only one distance between the atoms: Humans refer to this area as a “void”; but the void is many times larger than an atom. If the atomic distance changes, the void and the condition of the neighboring atoms changes as well. In theory it can be ascertained up to an infinite range.
Since these smallest changes take place in within an incredibly short timeframe, we as humans are unable to determine when and where something happened first. One cannot measure the necessary force vectors. Therefore it is impossible to get two equal measurements. The development of another device type, confirming the knowledge derived from this fact began.
THE NEW PATH
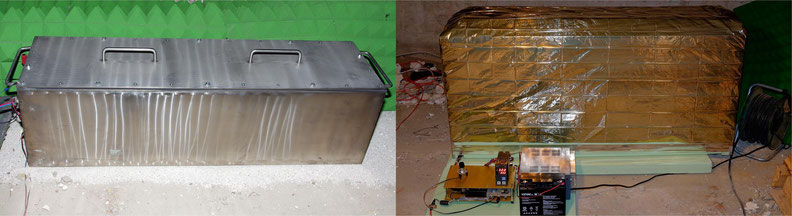
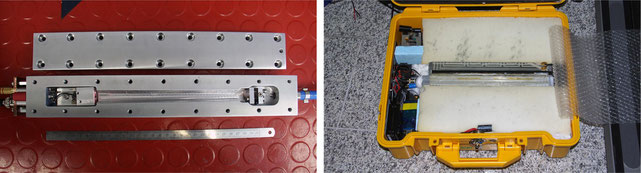
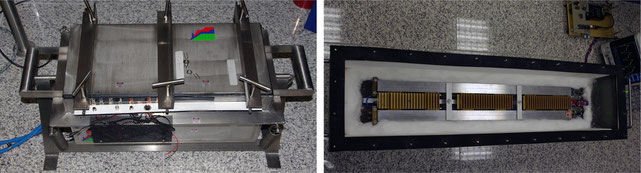
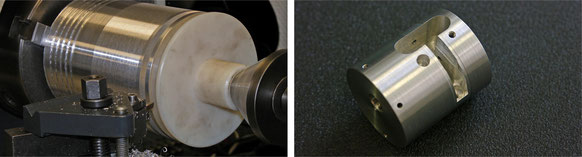
A sensor embracing the mass movement, laser technology, magnetism and thermodynamic influences was created at the laboratory.
Due to the confidentiality of this project, all individual components have been produced in-house! The peripheries, such as housing, measuring electronic and corresponding software were also produced in-house.
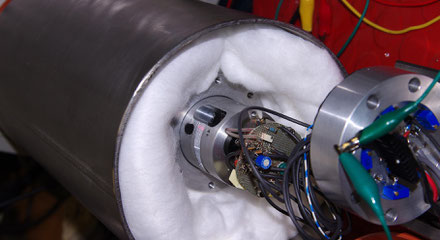
The additional measurements and diagrams were derived with this device.
This procedure has nothing in common with the traditional seismological methods. The extreme sensitivity and the scope of frequency to be assessed defy the current seismographic measurements!
The sensitivity of this device is significantly higher than in superconductive gravimeters. Therefore it is not surprising that the continental drift and the continental shift can be measured in real time similar to a car’s speedometer.
Since the earth rotation, change in angles and gravitation as well as the ego-motion must be considered in the measurements, a complex analysis has to be conducted with the assistance of several sensors. This enables us to determine the individual physical volumes.
To determine the location of the anticipated earthquake several measuring devices must be integrated in a network. The mathematical data must be calculated on a computer with the adequate software.
Let’s discuss measurements now. Since I am measuring on an imploded mountain platform here in Remagen, I’m obviously recording several interfering signals from the urban surroundings,
Therefore one can only detect earthquakes at a level of 6.5 or higher.
Over the course of years, the proportional connection between forecast and strength of the earthquake has become apparent.
The analysis of data collected throughout the years disclosed two generally different signals for detecting earthquakes! We as humans, therefore have 2 chances prior to the catastrophe.
The initial occurrence prior to the earthquake focuses on a change in rotation with a corresponding change of the earths’ angle.
The new measuring systems can be optimized for specific changes. For instance, one can determine whether measuring the rotation is more important than the change of the angle.
A 6.5 earthquake registers approx. 3-6 days prior with rotation and angle changes. 9.0 earthquakes seems to register 6 weeks prior.
The second similar signal for all earthquakes becomes apparent approx. 12-36 hours before the earthquake. The earth begins to vibrate like a defective bell.
A partial FFT-analysis indicates unsymmetrical vibrations of the earth at a significant level.
Around 87 minutes during the Honshu earthquake. Immediately after the earthquake, the signal diminishes and disappears.
All graphics shown are reduced by a factor of 200 due to the high data volume.
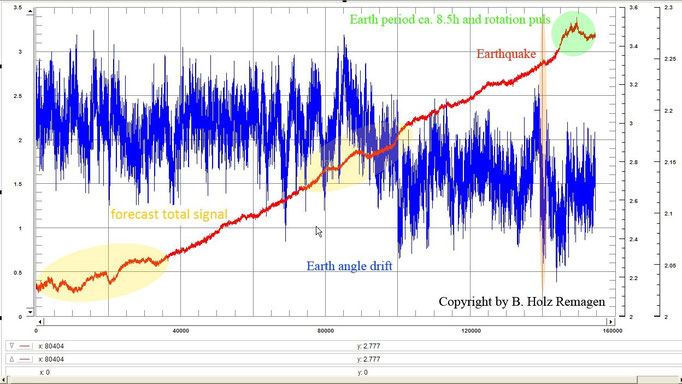
The following image demonstrates a forecast measurement, which is borderline possible here in Remagen. It should emphasize how the signal increases during rising activity as demonstrated below.
11/11/2012-11/17/2012 earthquake 6.5 on the Kuril Islands
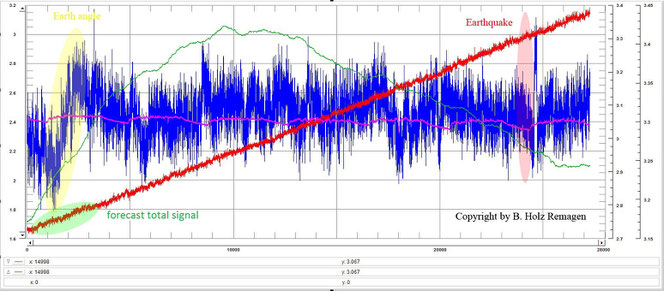
The red curve shows a linear rotation change of the earth. The lower left area highlighted in green indicates a slight abnormality.
The earth rotated somewhat slower for of several hours. You can monitor the timeframe of the angle change in the area highlighted in yellow in the blue graph. The earthquake as such, occured 5 days later and is highlighted in red.
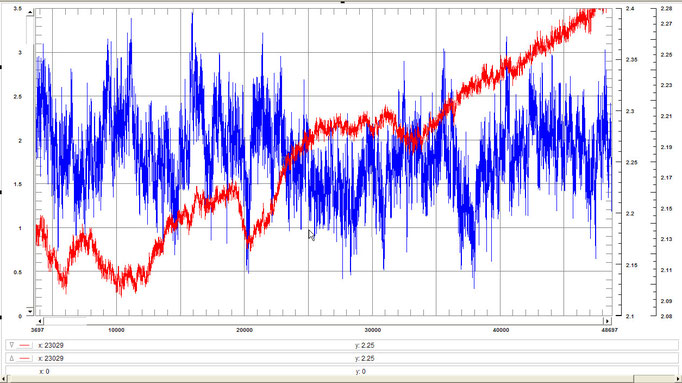
The following image demonstrates an enlarged version of the warning signal.
11/11/2012 previous warning Kuril Islands
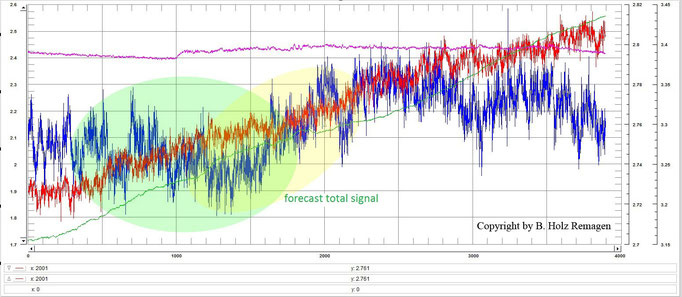
The green area shows an abnormality barely determinable in Remagen.
Let’s discuss the opposite extreme, the strong earthquake in Honshu at a 9.2 level
02/01/2011-03/14/2011 Honshu 9.2
The long-term overview already demonstrates the significant rotation and angle change.
Even after the earthquake, you can see how the dramatically the earth changes its rotation speed three times within approx. 8 hours in the green field on the right side behind the area highlighted in red.
The rise in the red curve following the earthquake also demonstrates how the potential energy conserved for decades is now eroded by the earths’ vibration and the water volume.
The blue curve demonstrates how the angle of the earth has changed on two levels. In this earthquake of the century, the angle of the earth did not return to the level it was prior to the quake. Therefore this earthquake still has significant consequences today, which have yet to be determined.
Here is the enlarged version of the clearly detectable warning signal of long-term early recognition
This quake in Honshu has been recorded simultaneously by a second modified testing device. The following image shows the same timeframe from 02/01/2011-02/14/2011 as the previous page.
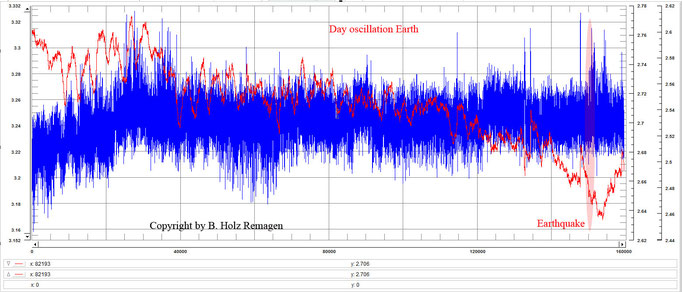
The daily fluctuations of the earth are clearly visible. Approx. 2 days prior to the earthquake this signal disappears. The earth changes to a different vibration mode.
The following images document the previously mentioned FFT-Analysis. Each image represents the assessment over an approx. 3 hour time-period. A few days before the quake, the analyses are the same. Nothing noticeable can be detected.
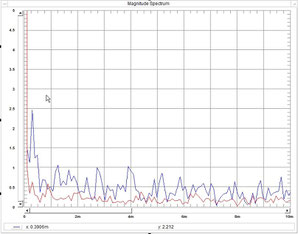
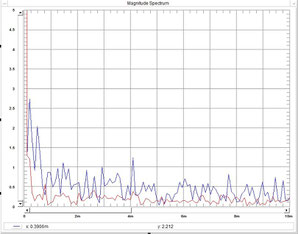
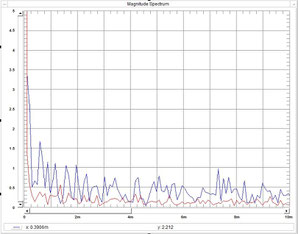
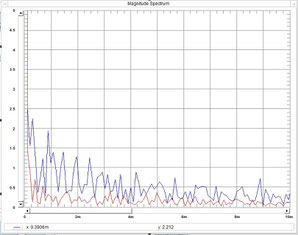
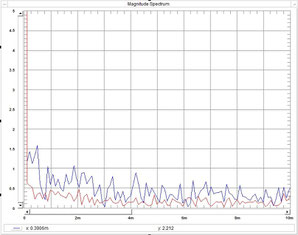
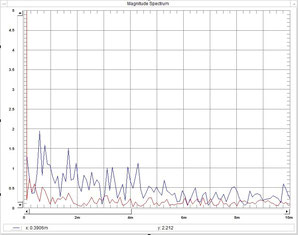
Up until approx. 8 hours prior to the earthquake the second and last warning signal is registered. The disharmonious earth vibrations become apparent. After the earthquake, the signal diminishes and disappears.
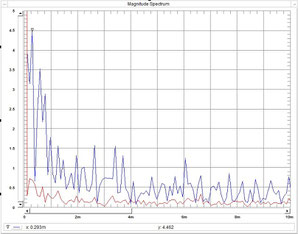

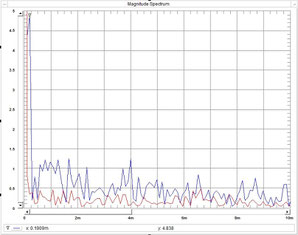
These types of vibration changes have been measured in all of the more severe earthquakes. They ranged from a timeframe of 170 to 10 minutes on different levels and are unknown as of today.
SUMMARY
Diverse ultra-small physical volumes can be measured due to the invention and development of this innovative sensor. Changes in the earths’ body in the sub-atomic area become visible. This new procedure finally enables us to access an effective “earthquake forecast”.
Not to be confused with the current interpretation of “earthquake forecast”, which only warns its surroundings after the occurrence of an earthquake. It has nothing in common with prevention.
Due to the development of this sensor and networking several devices the warning can be issued prior to the quake. Obviously, some mathematical and technical details still have to be fine-tuned in collaboration seismologists and universities.
The results will then top the impossible